LOCAL ELECTION INFORMATION

Understand the system.
Strengthen local oversight.

A resident-focused guide to the four-part framework presented by election-integrity researchers—and the proposed path toward greater local visibility and participation.

“The work begins with what residents can see, document, and discuss in their own communities.”

— LOCAL OVERSIGHT PRINCIPLE

WHY THIS PAGE EXISTS

Information is the first layer of oversight.

A Rasmussen poll cited in the presentation found that two-thirds of voters were concerned about machines flipping votes. Concerns about election machines and reported results are difficult to understand without a clear view of the technology, records, and processes involved.

This page breaks the subject into a sequence that begins with the voter database, moves through early-voting data and election modeling, and then considers electronic voting and reporting systems. Each section brings together presentations, graphs, court-evidence emails, and related material for readers who want to follow the framework from local records to broader context.

ELECTION RIGGING 101 · SEPTEMBER 10, 2026

The complete narrative.

The supplied narrative is presented here in full. Linked material is collected in the document library and exhibit pages.

How to Rig an Election 9/10/2026

Rasmussen polls find two-thirds of voters across party lines are concerned about “machines flipping votes.”

Rasmussen polls
Gallup polls

These concerns are justified but it’s hard for most voters to defend their position given the complexities of the election technology and processes, and their use to corrupt election results.

It’s best to address voter concerns by segmenting election problems: 1) the voter database and its management, 2) election modeling and outcome prediction, and 3) the electronic voting system, both hardware and software.

The database issue is first a problem of bloat in the voter rolls, specifically the accumulation of voters who are deceased, moved, illegal, or non-existent. Many of these ineligible voters haven’t been purged per state statutes, or have been hurriedly added by registration mills in the run-up to elections. Database bloat provides headroom to keep vote totals including ballot injections at historic voter participation levels, roughly 78% in presidential elections to avoid raising suspicions.

The second aspect of the database problem is the management or rather mismanagement of databases to enable “ballot stuffing”. Investigators report the conversion of inactive ineligible voters to active, special tags and even cryptographic shuffling to disburse or hide unpurged ineligibles.

Good election models can predict the number of ballots needed to prevail in election prior election day. Historic voter participation and preference research generate strong models. The models become references by which early voting data predicts election outcomes.

To the electronic voting systems issue, qualified specialists have been reporting serious vulnerabilities for more than 15 years. There are too many to fully explain all of them here other than to summarize as multiple ‘backdoors’ and vote manipulation methods, bad coding practices, weak communications port protections, hidden nefarious features and lies about equipment sources.

The general consensus of specialists is that it’s impossible to make an electronic voting system impervious to bad actors, particularly foreign states and hackers using artificial intelligence tools.

Below, we walk the reader through one election rigging scenario with relevant videos, court evidence emails, and other relevant materials.

Database Step

Dr. Frank explains database bloat that begins with normal churn reflecting voter deaths and relocations. Many of these database entrees are not being purged per statutes but rather left to become inactive after a no-vote period. Registration mills and pre-election individual registrations add to the bloat during a mandated “no-purge” pre-election window. Dr. Frank teaches a method to identify ineligible database entrees.

Dr. Frank Video (Relevant portion of “Churn” presentation)
Dr. Frank Bio

Election Prediction Step

The website https://www.electiondataguy.com is representative of organizations that project election results by analyzing early vote data against that of past comparable elections.

WI early voting data is available by subscription at https://badgervoters.wi.gov

Voting System Step

In the Byrne video below, Patrick reveals a hidden server that injects ballots.

VIDEO / VOTING SYSTEM STEP

Patrick Byrne video

Patrick’s plastic cup explanation of the hidden server was intended for a non-technical audience. The hidden server is not, in fact a separate physical module but rather a virtual machine, a compute resource implemented in software. It uses a portion of processor time in a host computer, in this case an existing election management server. Virtual machines can self-terminate and disappear with all evidence, in this case ballot injections when the system is powered off.

Patrick Byrne Bio

Patrick M. Byrne is an entrepreneur, scholar, and advocate best known as the founder and former CEO of Overstock.com. Beginning in 1999, he developed the online retailer into a major shopping platform, led it to its first full year of profitability in 2009, and oversaw early adoption of Bitcoin transactions and digital bonds issued on the Bitcoin blockchain. He later founded Medici Ventures to explore blockchain technology for securities trading and served as chairman of the Friedman Foundation for School Choice.

Byrne holds a bachelor’s degree from Dartmouth College, a master’s degree in philosophy from the University of Cambridge as a Marshall Scholar, and a Stanford University PhD in Constitutional Intellectual Origins.

Visit Patrick Byrne’s website →
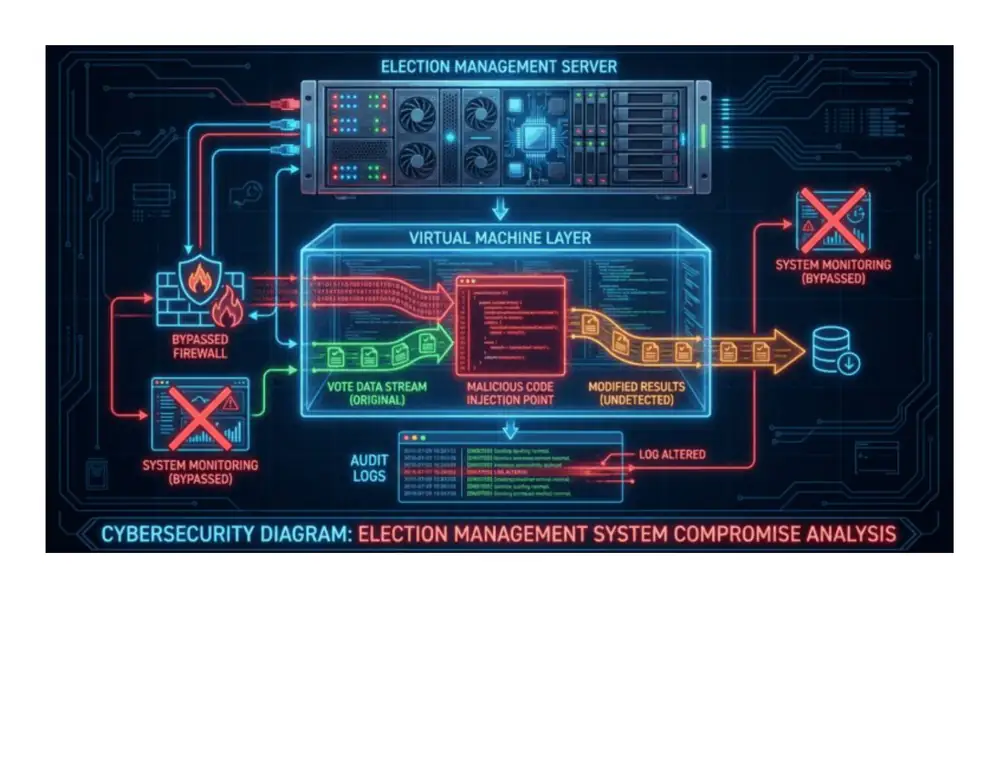
Cybersecurity diagram titled “Election Management System Compromise Analysis” showing a virtual machine layer inside an election management server that intercepts the vote data stream at a malicious-code injection point and forwards modified results while the firewall, system monitoring and audit log are bypassed or altered.
SUPPORTING GRAPHICVirtual Machine Graphic

Courtesy of Election Crime Bureau.

Patrick presents a number of court evidence emails that confirm the existence of the hidden server and tie Dominion to that server.

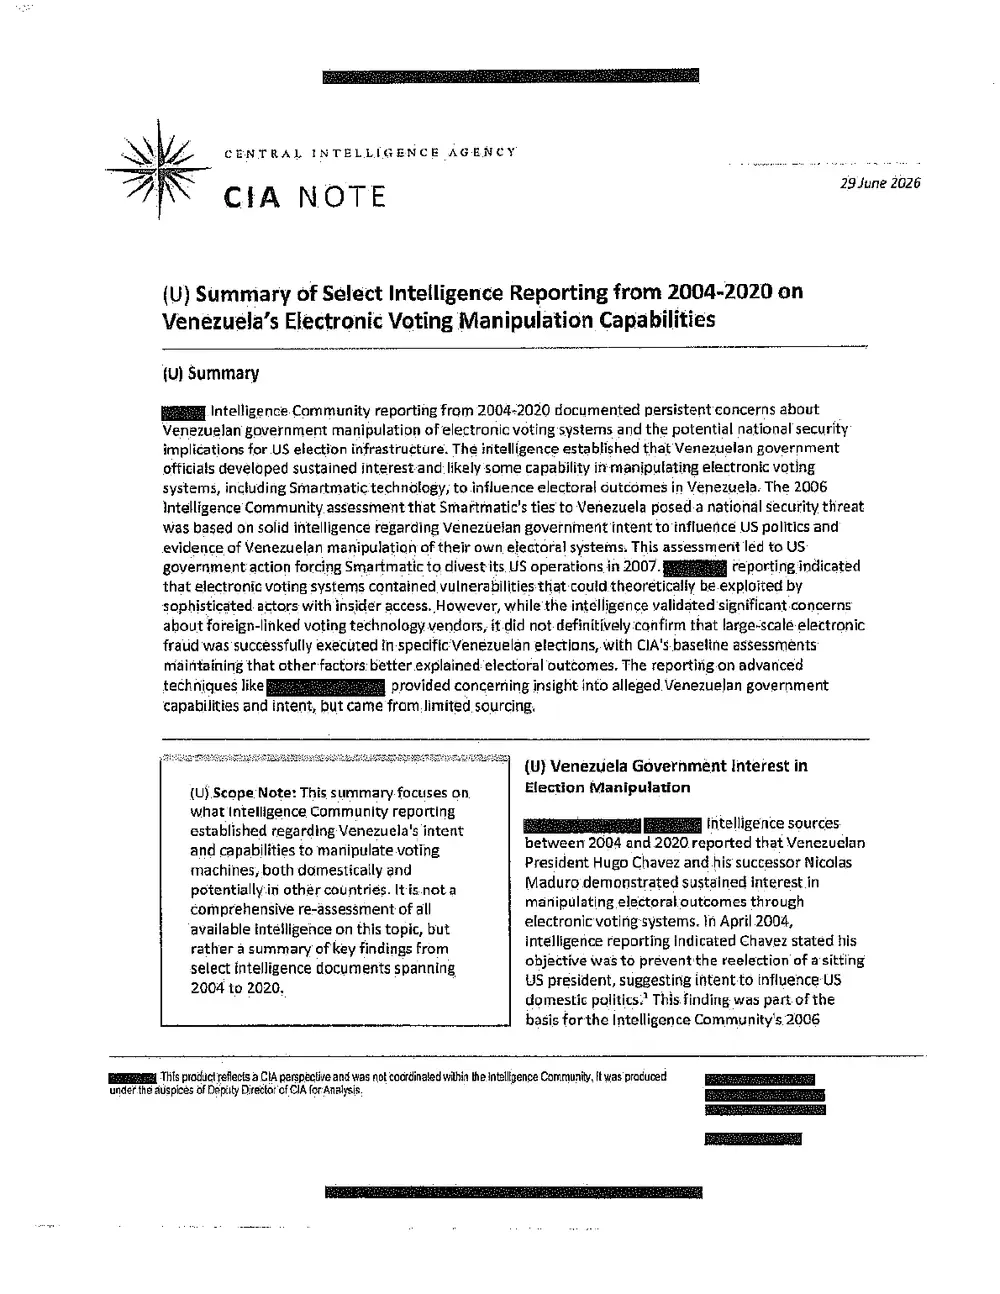
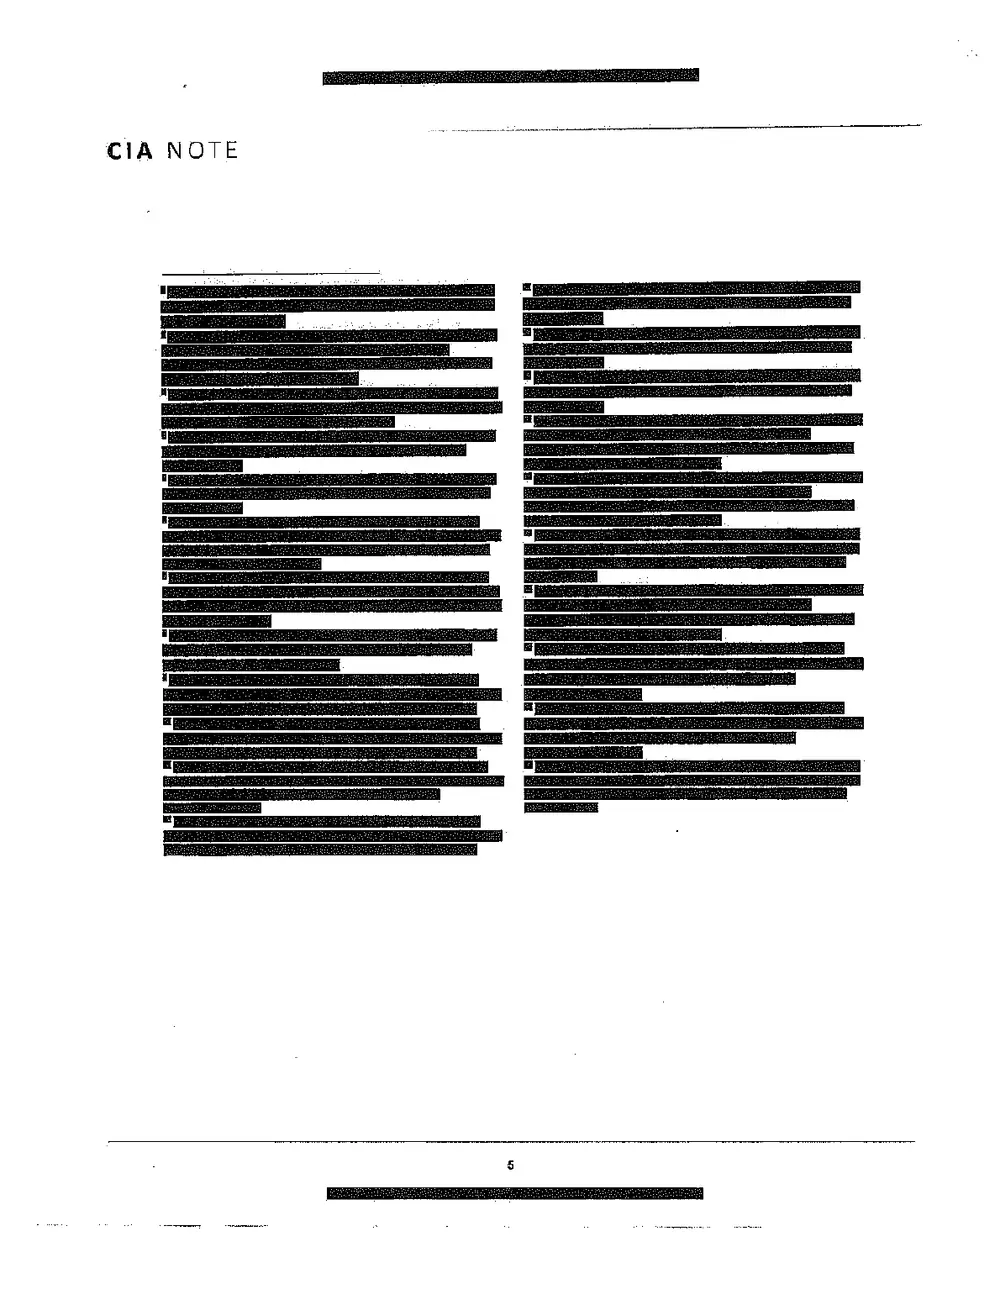
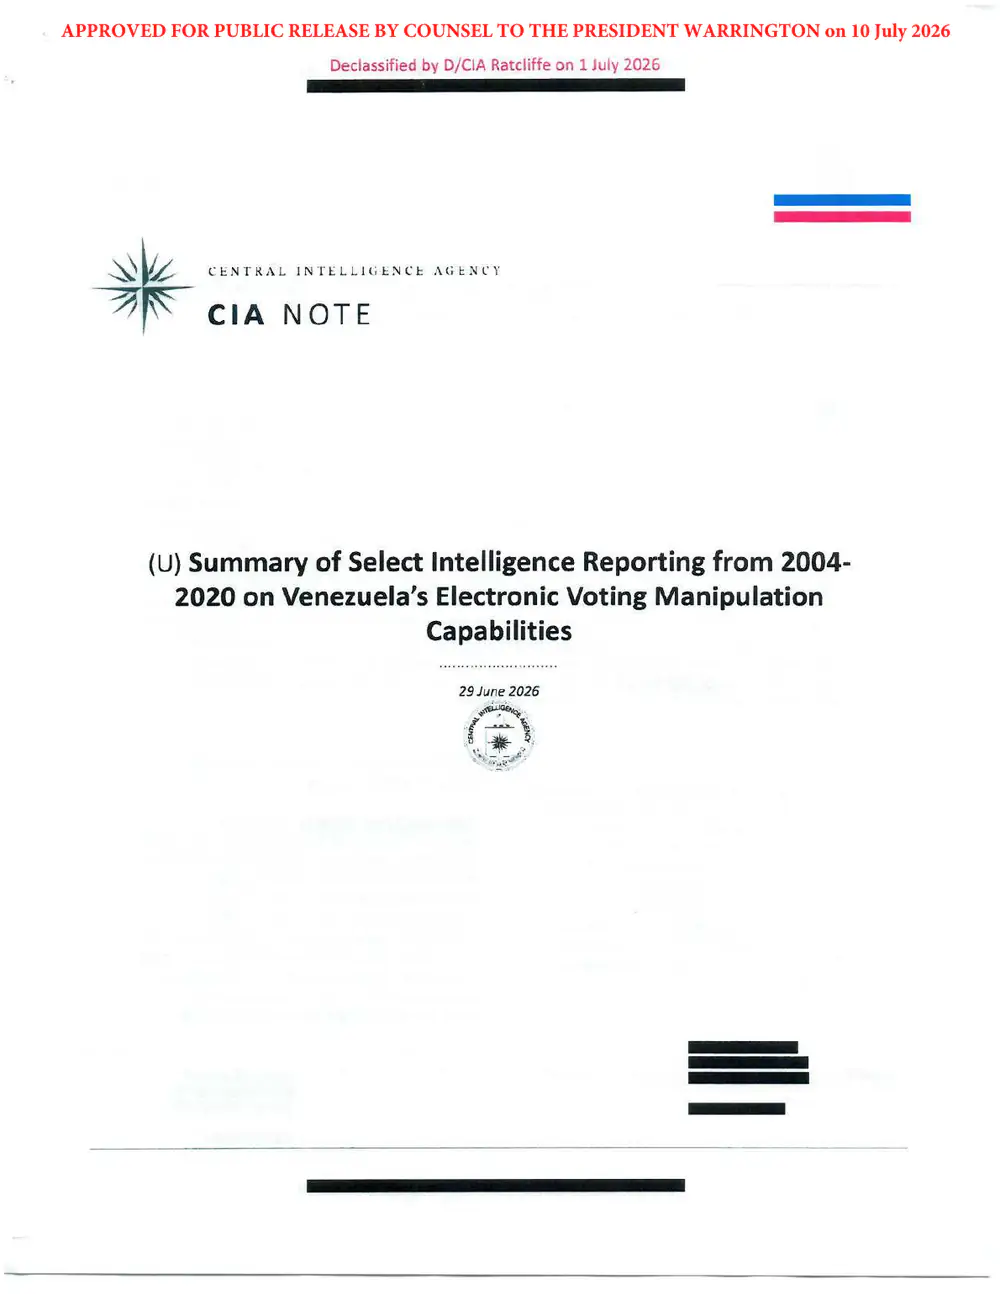
  1. Exhibit 1: Declassified CIA report “Venezuela’s Electronic Voting Manipulation Capabilities”
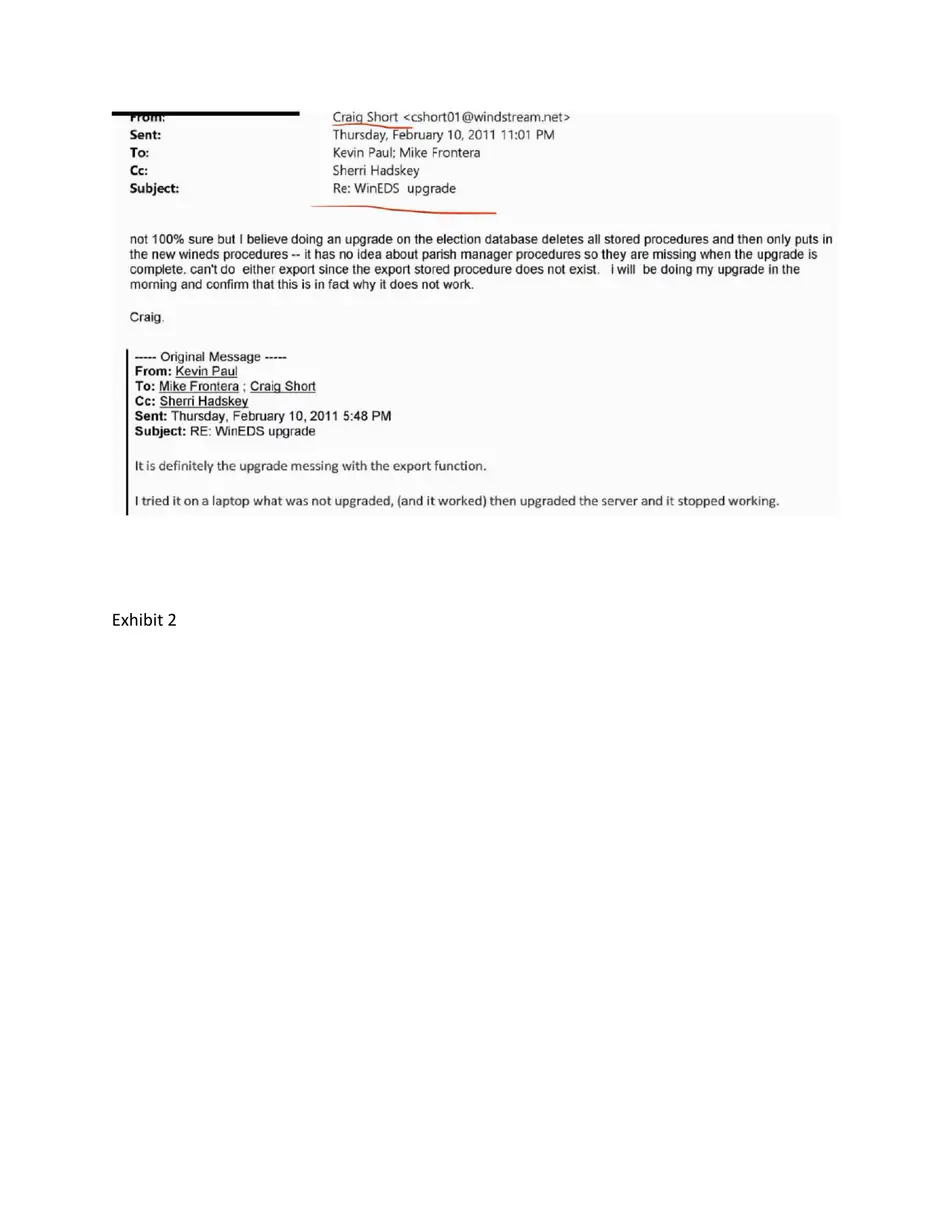
  2. Exhibit 2: Subject line in 2011 Email, WinEDS upgrade.
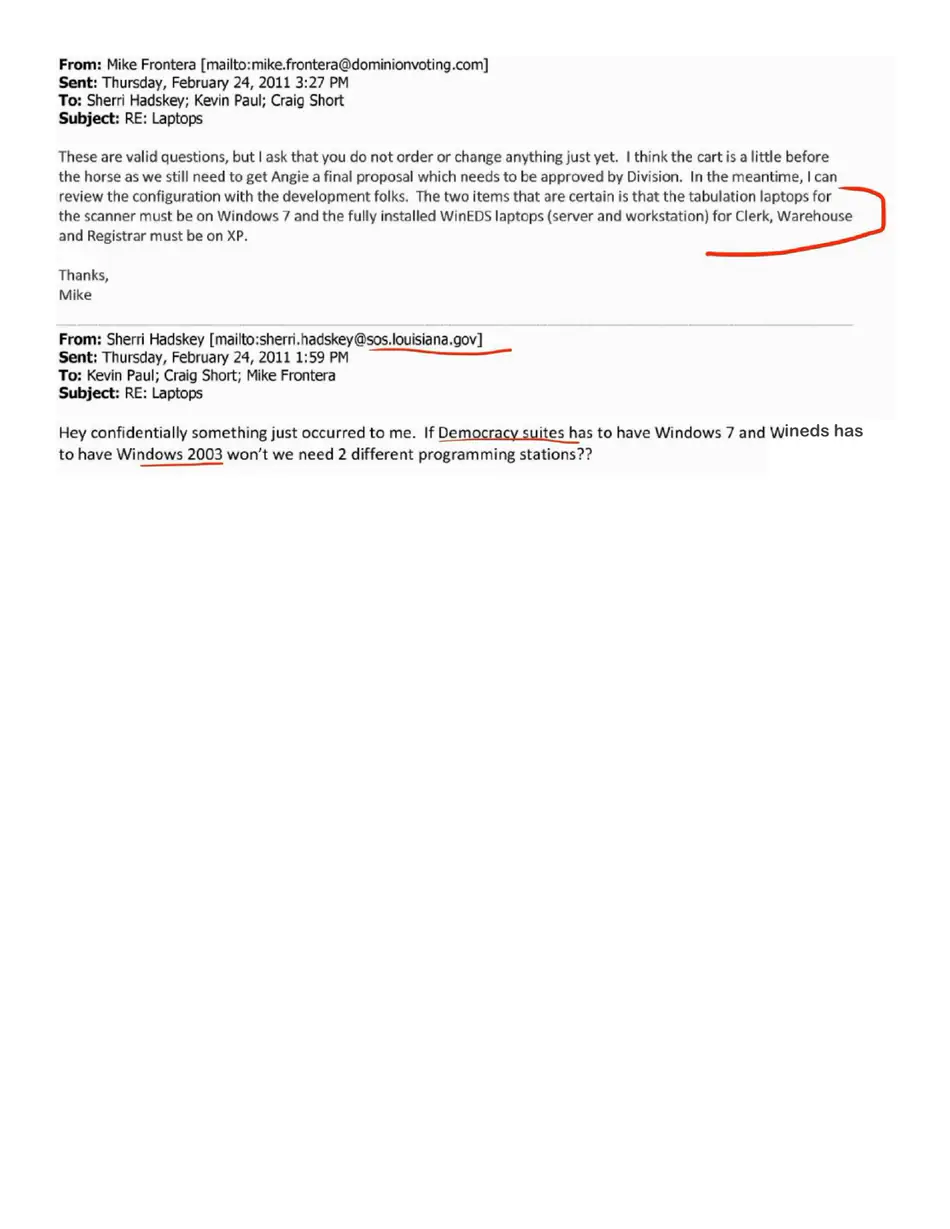
  3. Exhibit 3: 2011 Email, Louisiana Sec of State questions need for 2 servers with different Windows OS for Dominion’s Democracy Suite election management system. Responder indicates one is for WinEDS.
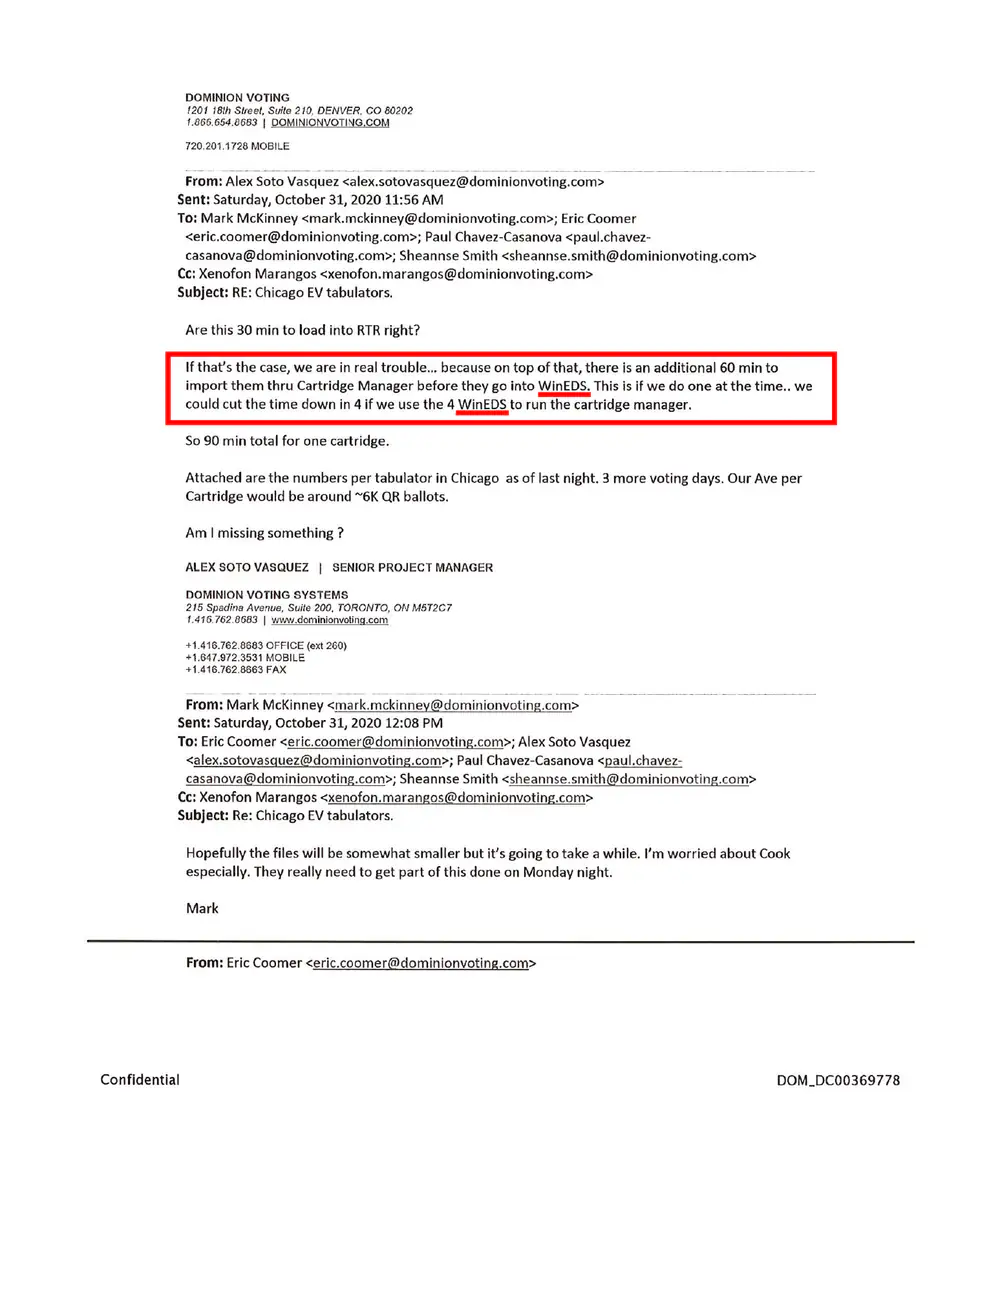
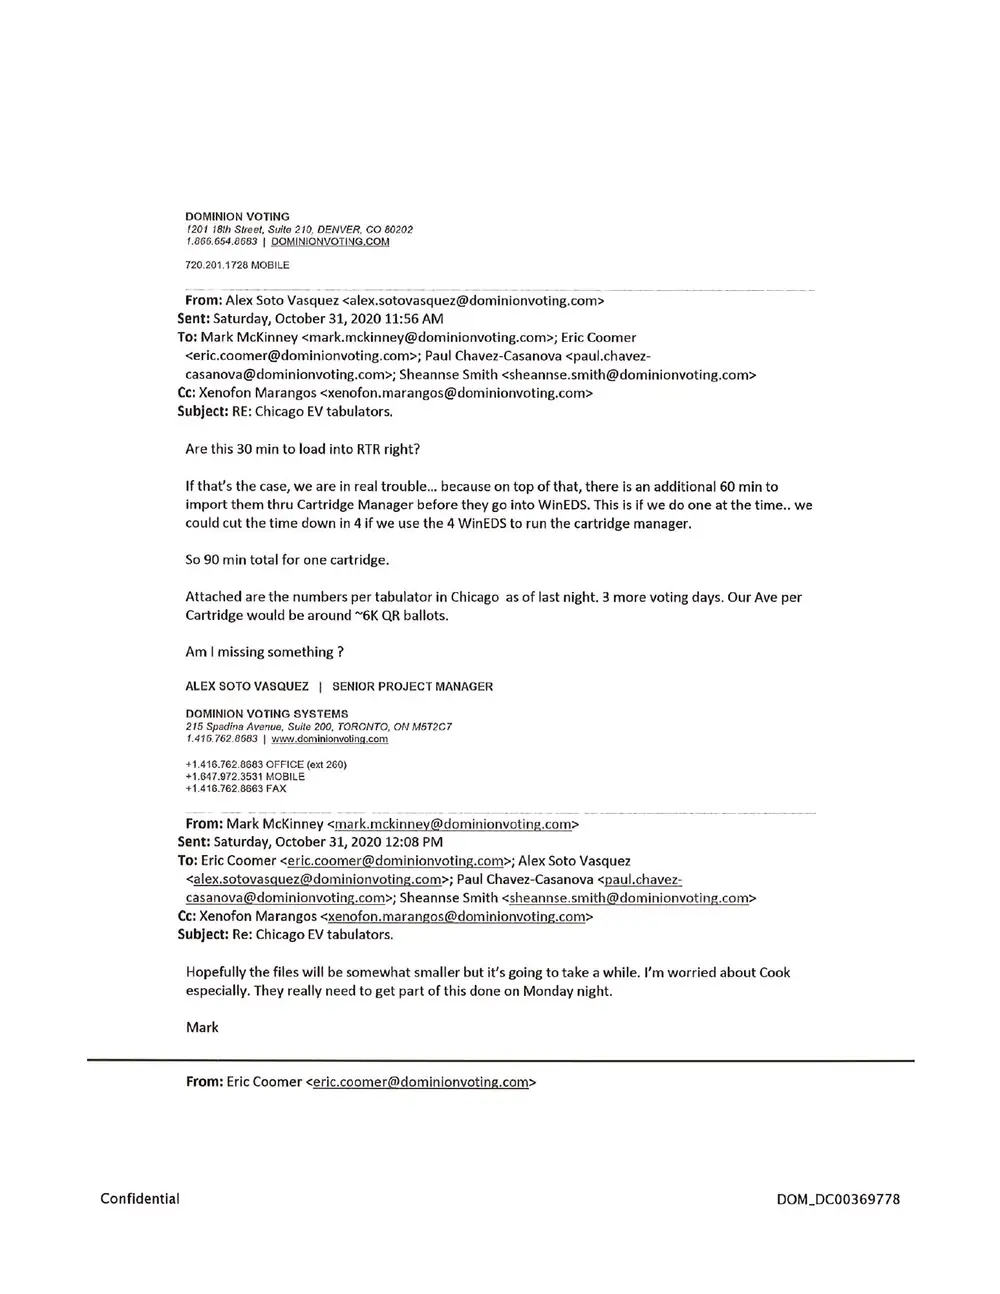
  4. Exhibit 4: 2020 Email, Dominion Tech discusses loading of info into WinEDS. Dominion’s been claiming WinEDS old stuff not used.
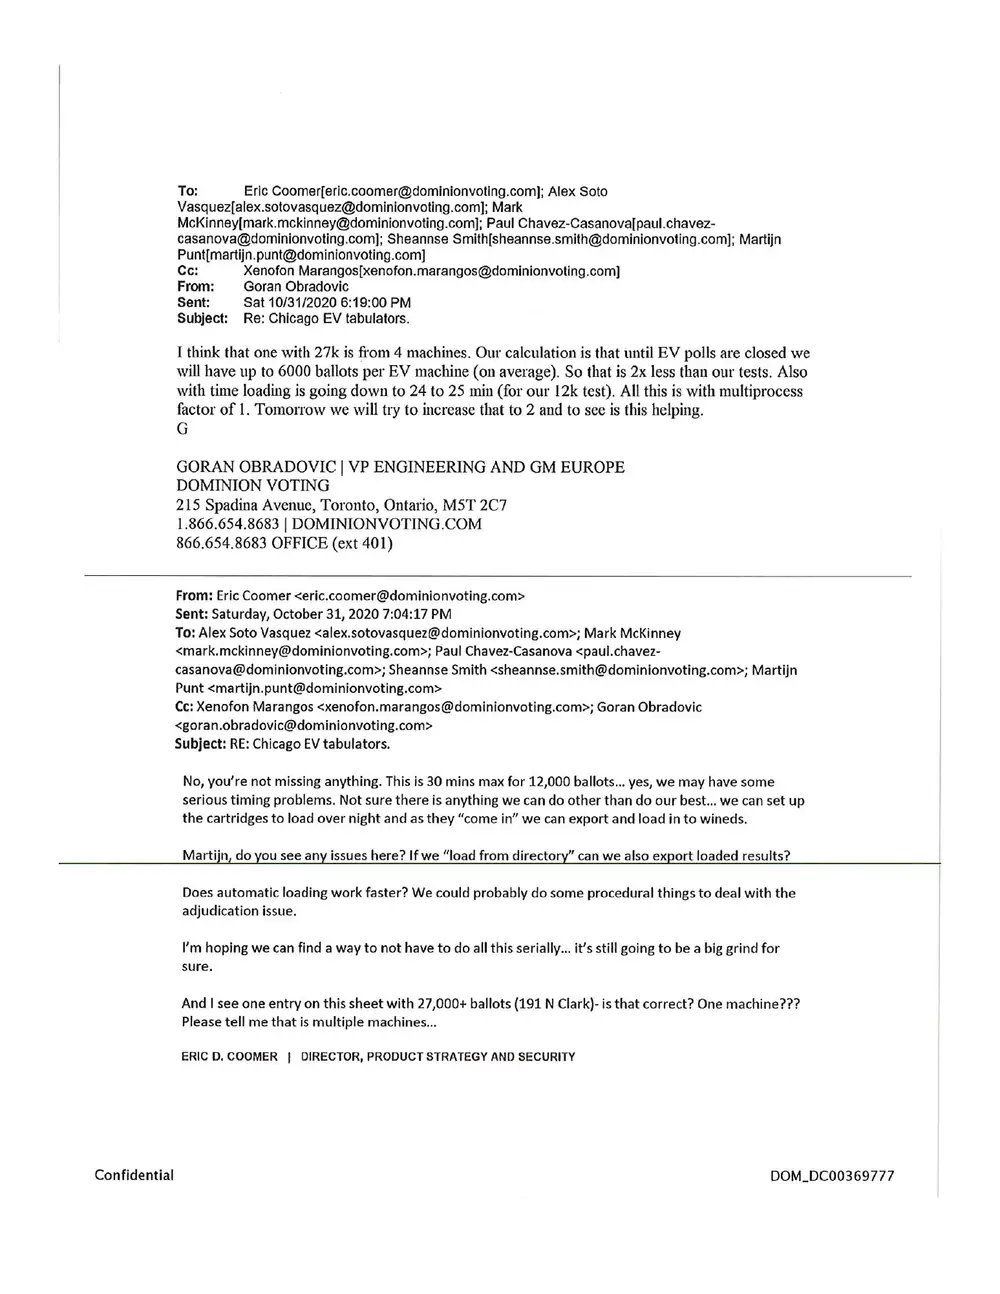
  5. Exhibit 5: 2020 Email, Coomer says can download cartridges [info from Serbia] overnight and as they “come in” [election results) we can load into WinEDS {ballot injection}.
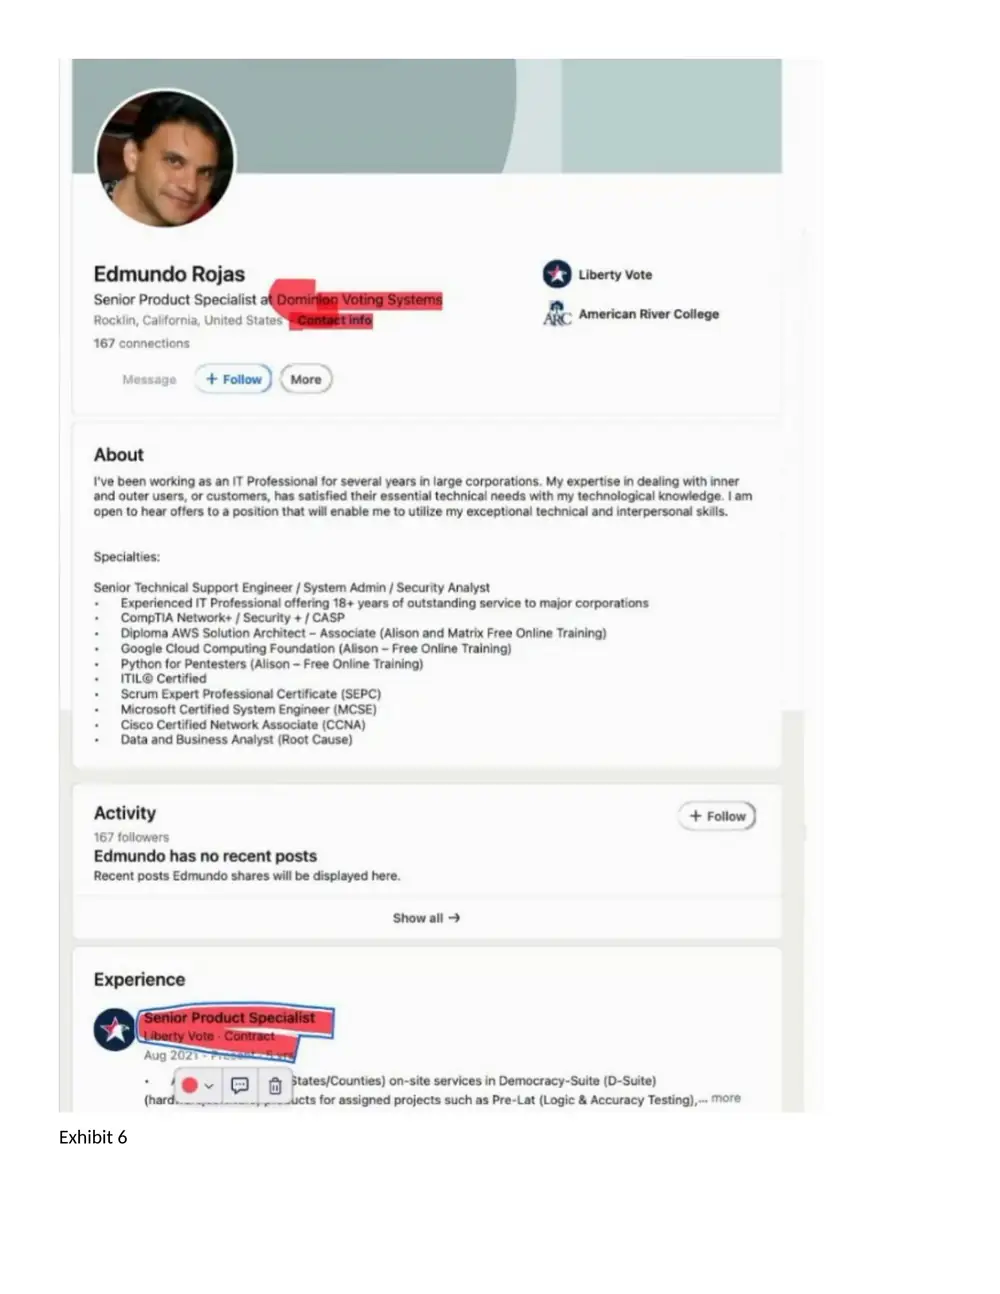
  6. Exhibit 6: Link-in page of Edmundo Rojas, Senior Product Specialist - work history with both Dominion and Liberty Vote. Dominion and Liberty Vote are same company with new owner.
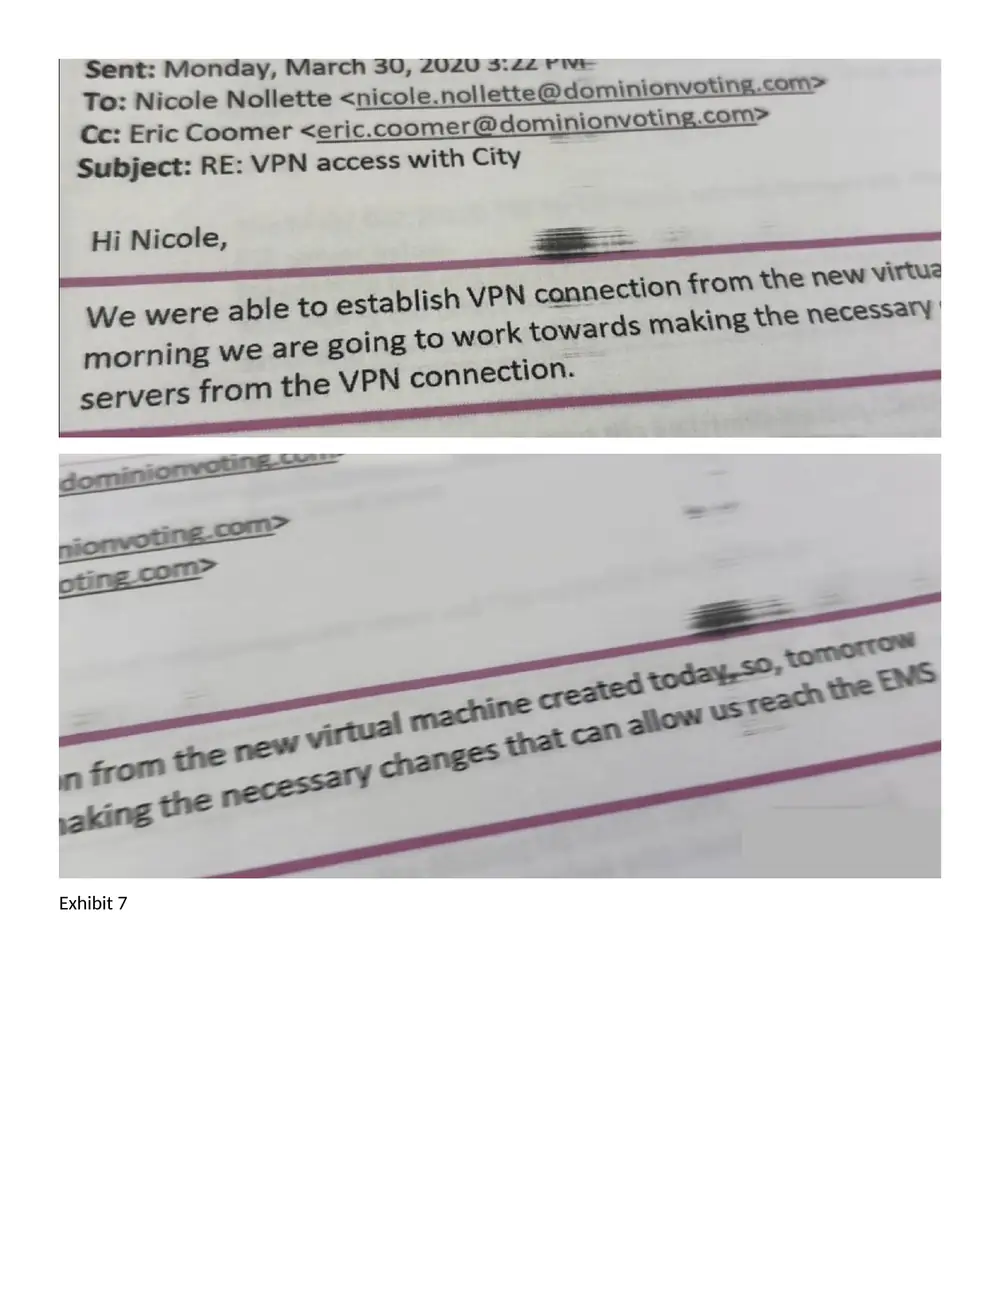
  7. Exhibit 7: 2020 Email Dominion Tech “Establish VPN connection virtual machine created today”
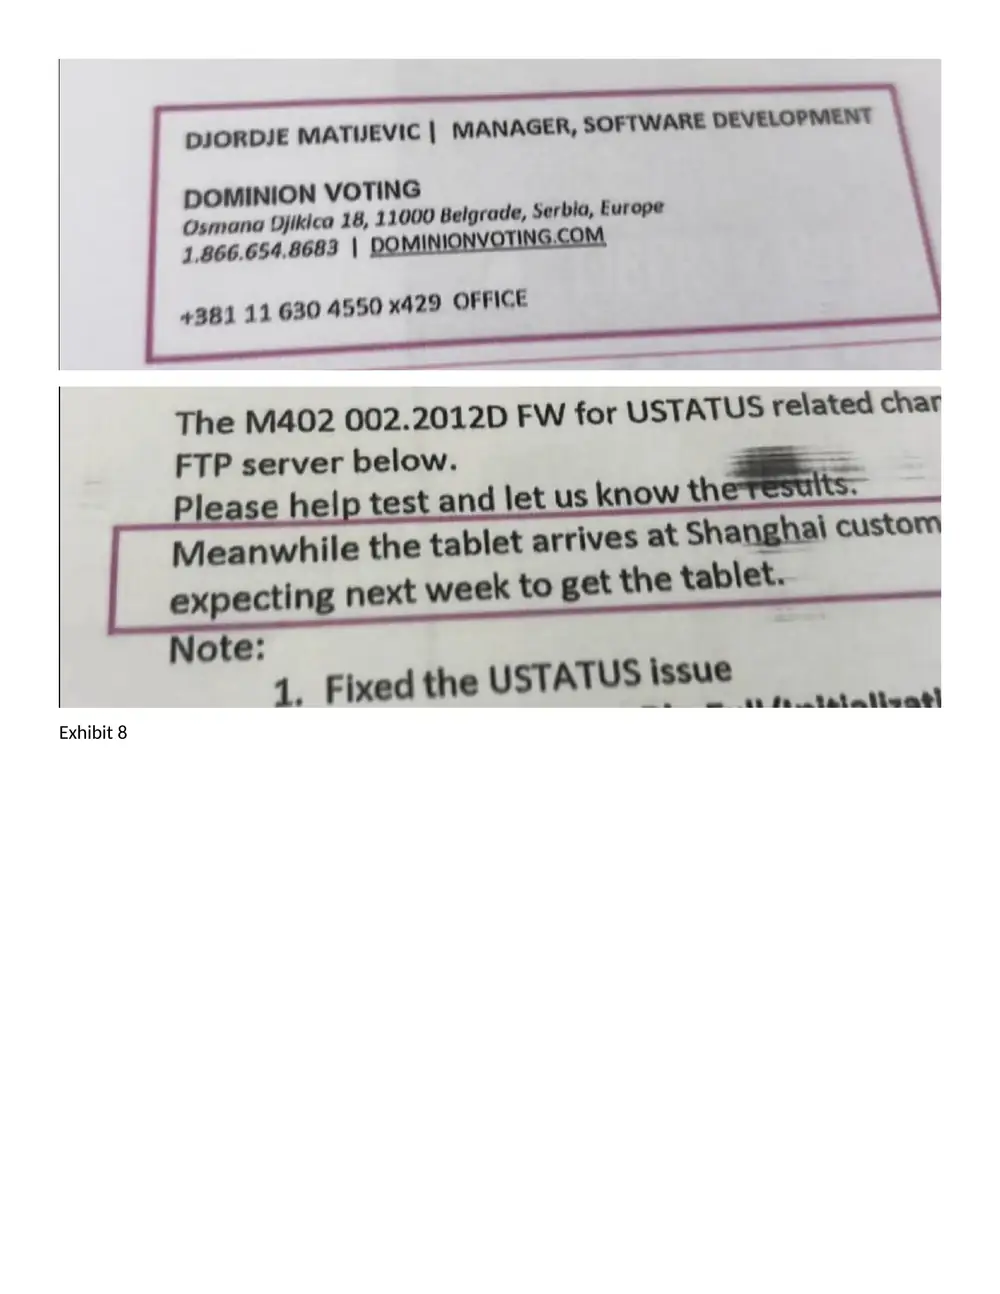
  8. Exhibit 8: Email from Serbia – “tablet arrives at Shanghai custom … expecting next week.”
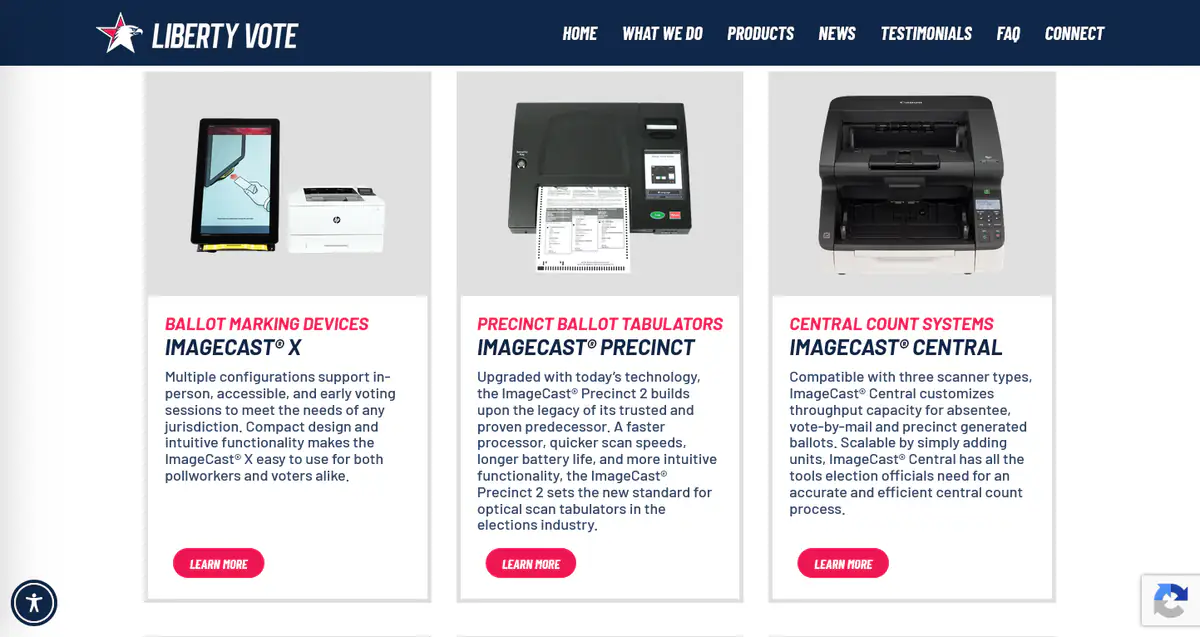
  9. Exhibit 9: Liberty Vote web page showing tablet. Increasing number of Chinese manufactured products being banned for having spyware and backdoor control features.

Patrick has been subject to a gag order during a lawsuit by Dominion that was intended to bury system information including the hidden server. 3 years into the case, the judge was discovered to have hidden previous representation of Venezuela, the source of the SmartMatic software at the root of WinEDS. The judge has been referred to DOJ.

EVENTS & PRESENTATIONS

Continue the conversation.

Upcoming programs and summaries from recent presentations.

Portrait photograph of Dr. Douglas Frank, the featured speaker at the upcoming Dane County Elections presentation.
THU 08 OCT 2026

UPCOMING EVENT

Dr. Douglas Frank

Join Dr. Frank for a presentation and local discussion on Thursday, October 8.

DOORS 5:30 PM · TALK 6:00–8:30 PM
DOUBLEDAYS · 4586 BAXTER RD · COTTAGE GROVE, WI
PAST EVENT JUL
14
2026

REX’S INNKEEPER · WAUNAKEE

“Who Is Controlling Our Elections?”

Tuesday, July 14, 2026 · Presentation began at 6:30 PM · Rex’s Innkeeper, 301 North Century Avenue, Waunakee, Wisconsin.

During the Dane County presentation, Dr. Frank discussed his view that election oversight begins closest to home. He encouraged residents to examine voter-roll records, compare changes over time, and work through town- and municipal-level structures rather than relying solely on county or state systems.

He also described his voter-roll analysis method, election modeling, and a trip to South Korea. The presentation connected those topics to a broader call for residents to organize, document questions, and take part in local election administration and oversight.

Explore the proposed local approach →

ABOUT THE SPEAKER

Douglas G. Frank,
PhD.

Douglas G. Frank, PhD, is a surface chemist, instrument designer, and industrial consultant based in the Cincinnati, Ohio area. Over a career spanning more than three decades, he has designed and built custom analytical and control instrumentation for industrial, academic, and government laboratories, including measurement systems used by consumer products manufacturers.

Dr. Frank holds a Ph.D. in Surface-Electroanalytical Chemistry and has 60 peer-reviewed scientific publications. In the election-reform work presented on this site, he began investigating election data at the request of state officials in Pennsylvania and other states, including Wisconsin. Since 2020, he has traveled across the country analyzing state voter rolls and working with officials, organizations, and non-partisan grassroots teams pursuing election reform in 48 states.

LATEST REPORTS

Reports, records, and source material.

New reports and supporting documents will be added here as they are released.

HOME / DOCUMENT LIBRARY / EXHIBITS

Exhibits in one place.

The narrative links directly to this list. Every exhibit is displayed here on the home page, including page images rendered from the supplied PDFs and Word documents.

01

Declassified CIA note

“Venezuela’s Electronic Voting Manipulation Capabilities,” dated June 29, 2026.

6 PAGES
Exhibit 1, page 1 of 6: cover page of a CIA Note titled “Summary of Select Intelligence Reporting from 2004-2020 on Venezuela’s Electronic Voting Manipulation Capabilities,” dated 29 June 2026 and marked declassified and approved for public release.
Exhibit 1 · Page 1 of 6
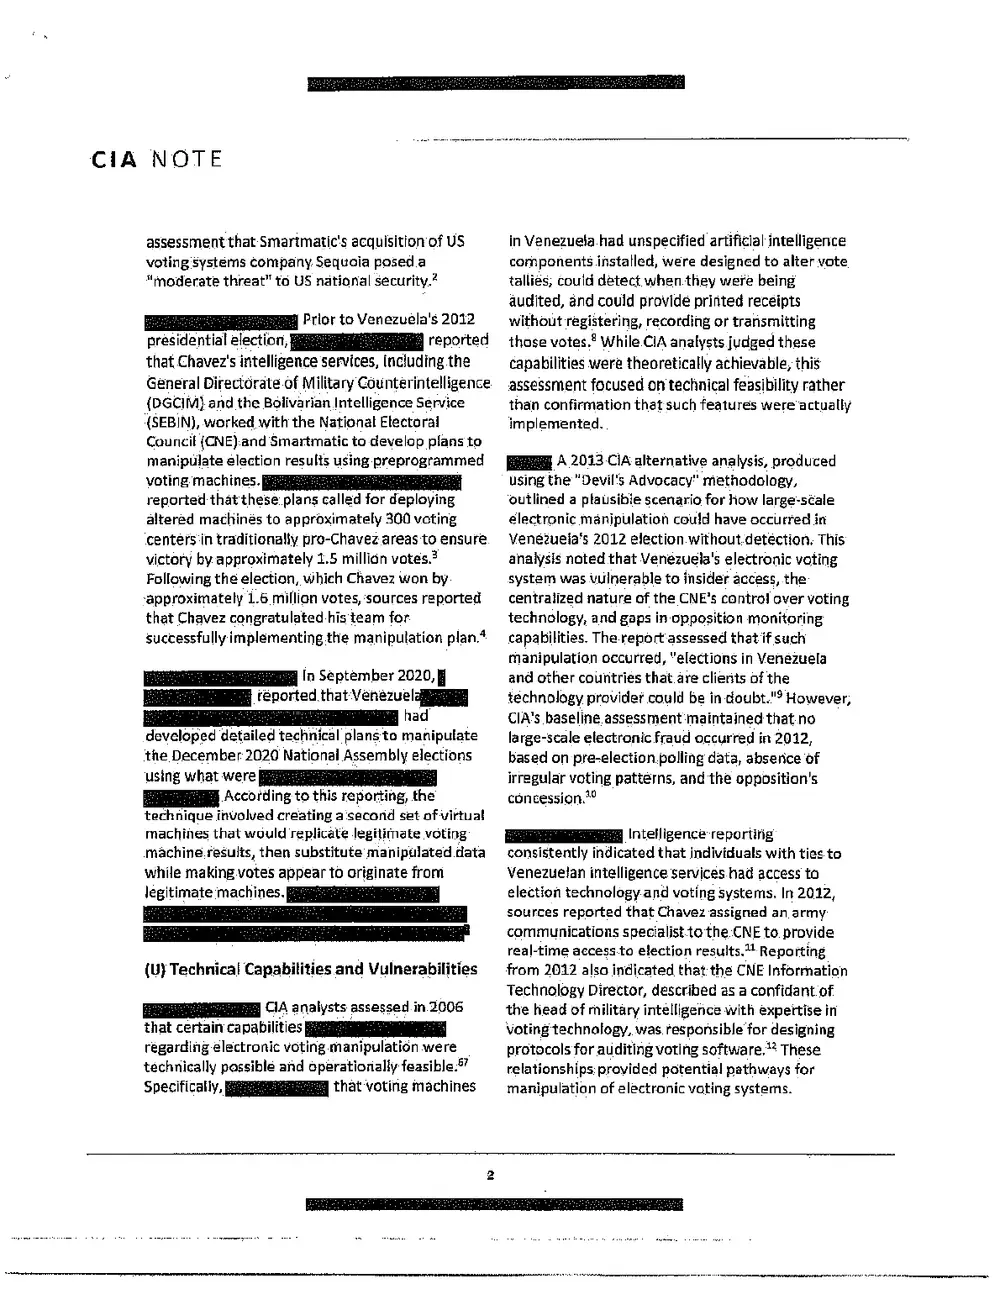
Exhibit 1, page 2 of 6: CIA Note summary reporting that 2004-2020 intelligence documented persistent concerns about Venezuelan government manipulation of electronic voting systems, including Smartmatic technology, followed by a scope note and a section on Venezuelan government interest in election manipulation.
Exhibit 1 · Page 2 of 6
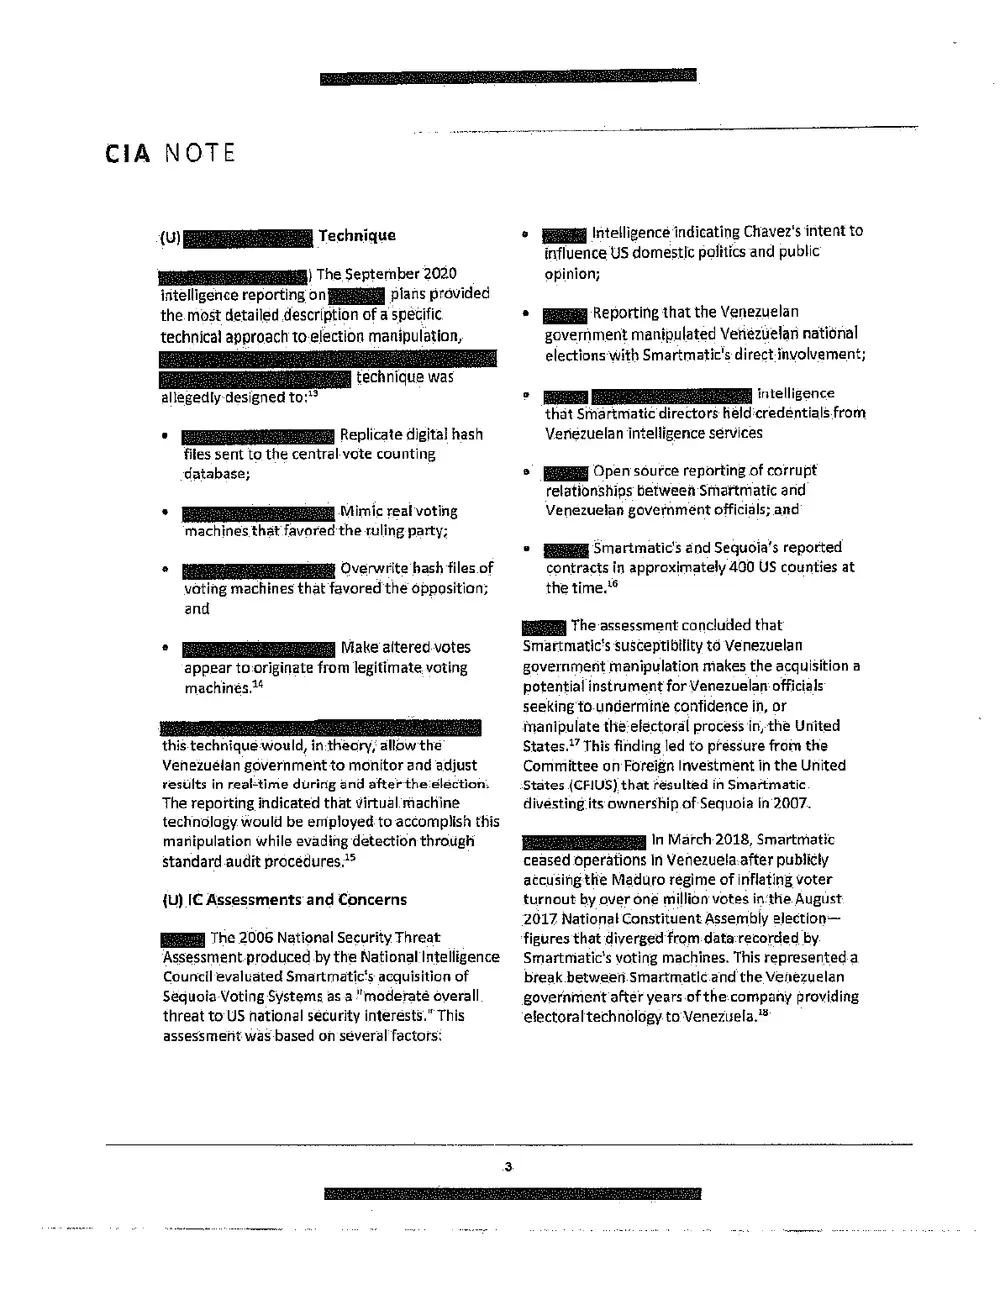
Exhibit 1, page 3 of 6: CIA Note describing plans to deploy preprogrammed voting machines in Venezuela’s 2012 election, a 2013 “Devil’s Advocacy” alternative analysis of how large-scale manipulation could occur undetected, and technical capabilities and vulnerabilities of electronic voting systems.
Exhibit 1 · Page 3 of 6
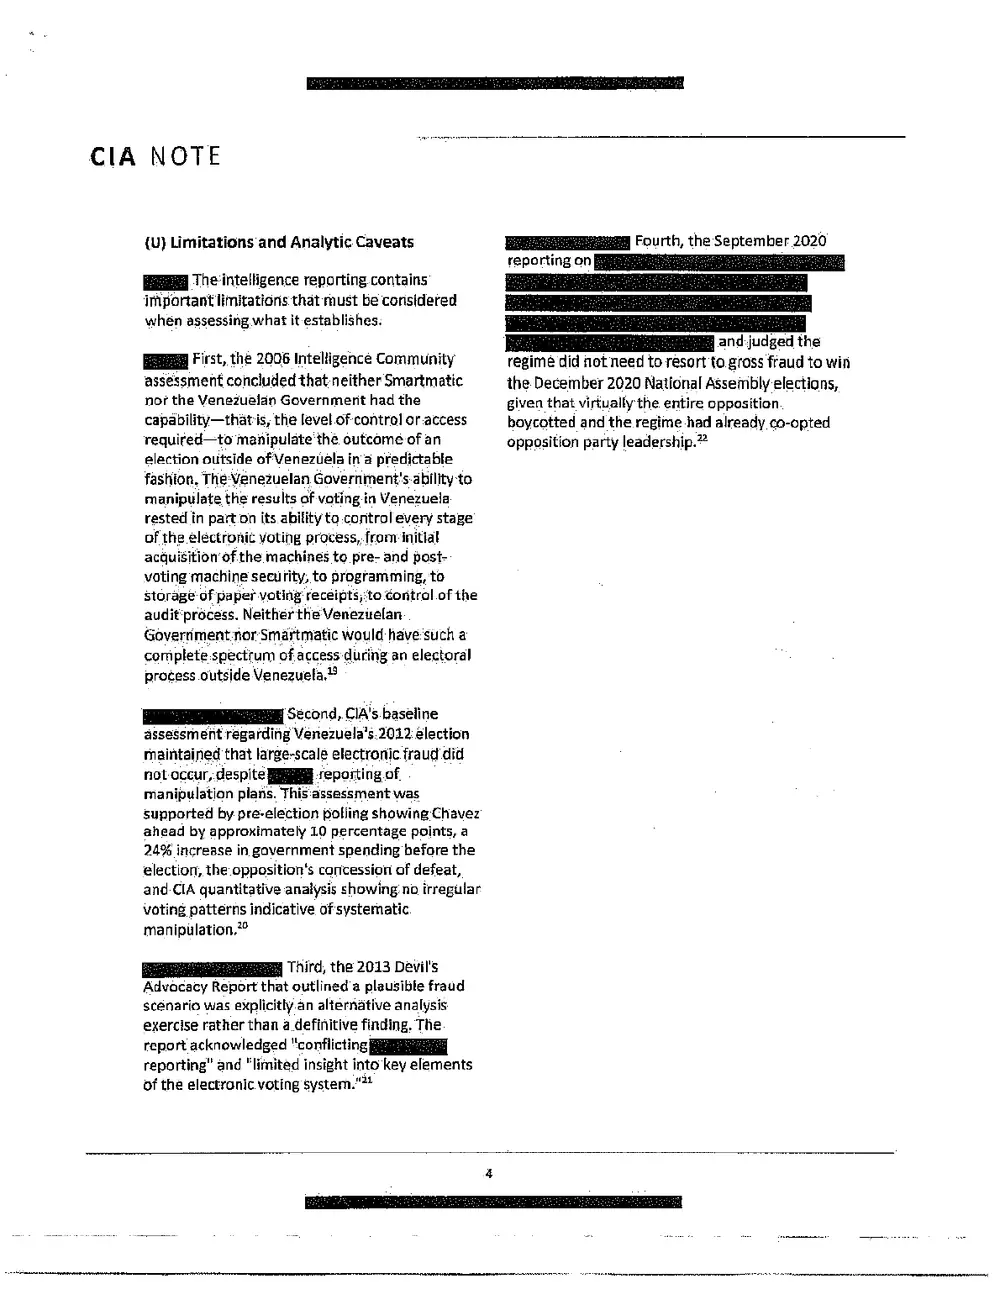
Exhibit 1, page 4 of 6: CIA Note listing a September 2020 election-manipulation technique that would replicate hash files, mimic voting machines favoring the ruling party, overwrite opposing machines’ hash files, and make altered votes appear to come from legitimate machines, plus IC assessments of Smartmatic and Sequoia Voting Systems.
Exhibit 1 · Page 4 of 6
Exhibit 1, page 5 of 6: CIA Note limitations and analytic caveats noting that neither Smartmatic nor the Venezuelan government had the access needed to manipulate an election outside Venezuela, that CIA’s baseline assessment found no large-scale electronic fraud in Venezuela’s 2012 election, and that the 2013 Devil’s Advocacy report was an alternative analysis rather than a finding.
Exhibit 1 · Page 5 of 6
Exhibit 1, page 6 of 6: final CIA Note page occupied almost entirely by heavily redacted source-note lines, with the printed page number 5.
Exhibit 1 · Page 6 of 6
02

WinEDS upgrade

Subject line and supporting material from the corrected 2011 email exhibit.

1 PAGE
Exhibit 2: February 2011 email from Craig Short with the subject “Re: WinEDS upgrade,” warning that upgrading the election database deletes all stored procedures, above the original message from Kevin Paul reporting that the export function failed after a server upgrade.
Exhibit 2 · PDF rendered as an image
03

WinEDS use confirmed

Corrected 2011 email concerning two servers, differing Windows systems, and WinEDS.

1 PAGE
Exhibit 3: February 2011 email chain in which Mike Frontera of Dominion Voting states that tabulation laptops for the scanner must run Windows 7 while the fully installed WinEDS laptops for Clerk, Warehouse and Registrar must run XP, and Sherri Hadskey of the Louisiana Secretary of State asks whether two different programming stations would then be required.
Exhibit 3 · PDF rendered as an image
04

WinEDS information loading

Corrected 2020 email about loading information through Cartridge Manager into WinEDS.

1 PAGE
Exhibit 4: October 2020 Dominion Voting email from Alex Soto Vasquez stating there is an additional 60 minutes to import files through Cartridge Manager before they go into WinEDS, with that passage highlighted in a red box.
Exhibit 4
05

Coomer / WinEDS email

Corrected 2020 email chain concerning cartridges and information loaded as results arrive.

4 PAGES
Exhibit 5, page 1 of 4: October 2020 Dominion Voting email chain “Re: Chicago EV tabulators” in which Goran Obradovic estimates up to 6,000 ballots per EV machine and Eric Coomer replies that 30 minutes is the maximum for 12,000 ballots.
Exhibit 5 · Page 1 of 4
Exhibit 5, page 2 of 4: October 2020 Dominion Voting email from Alex Soto Vasquez describing 90 minutes total per cartridge, followed by Mark McKinney’s reply about file sizes and concern for Cook County.
Exhibit 5 · Page 2 of 4
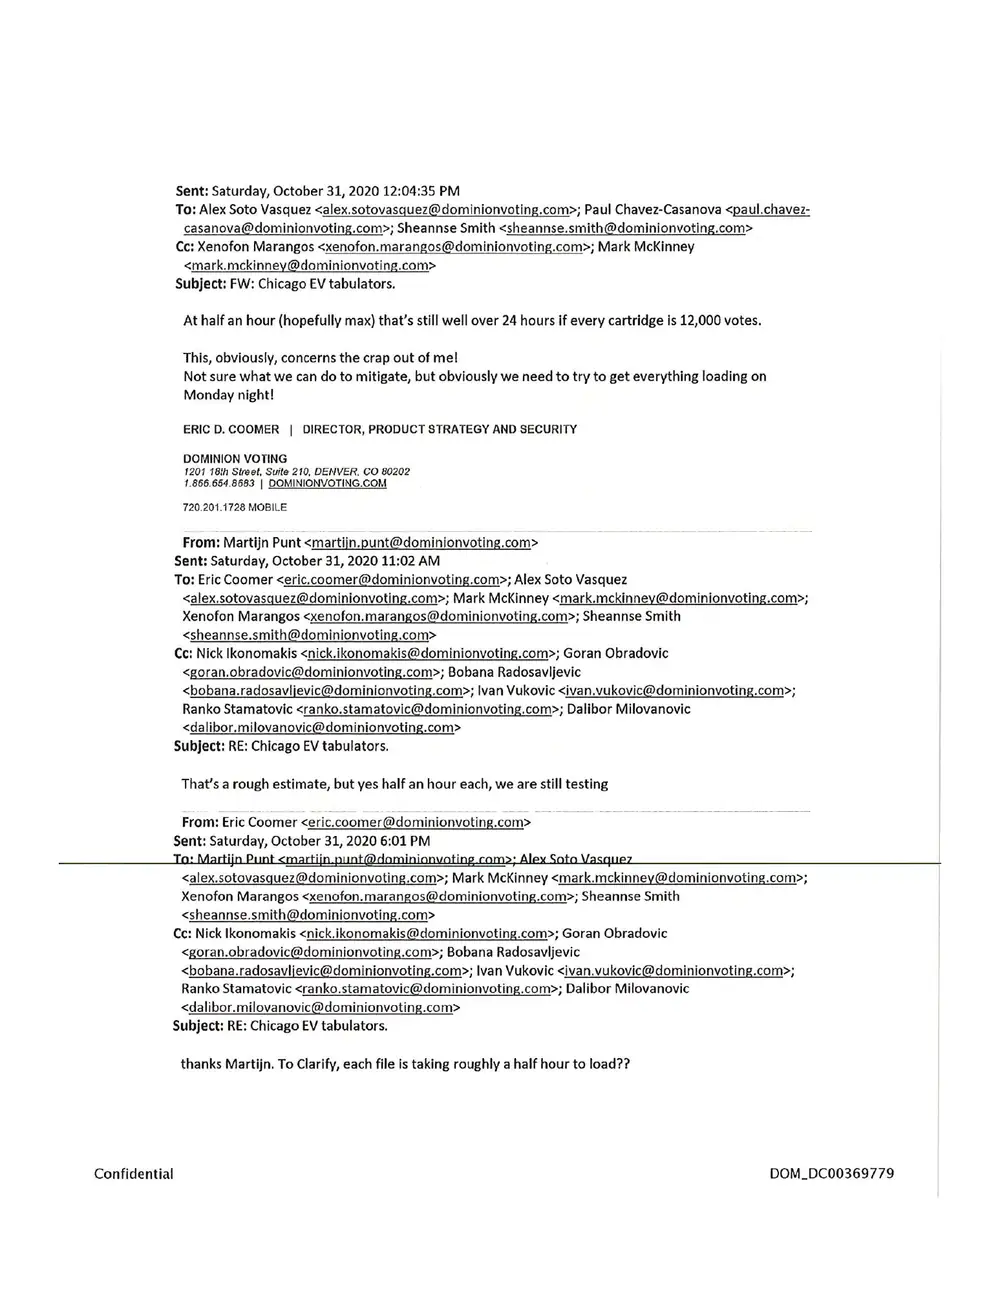
Exhibit 5, page 3 of 4: October 2020 Dominion Voting email chain in which Eric Coomer warns that half an hour per cartridge would run well over 24 hours if every cartridge holds 12,000 votes, and Martijn Punt confirms the estimate is still being tested.
Exhibit 5 · Page 3 of 4
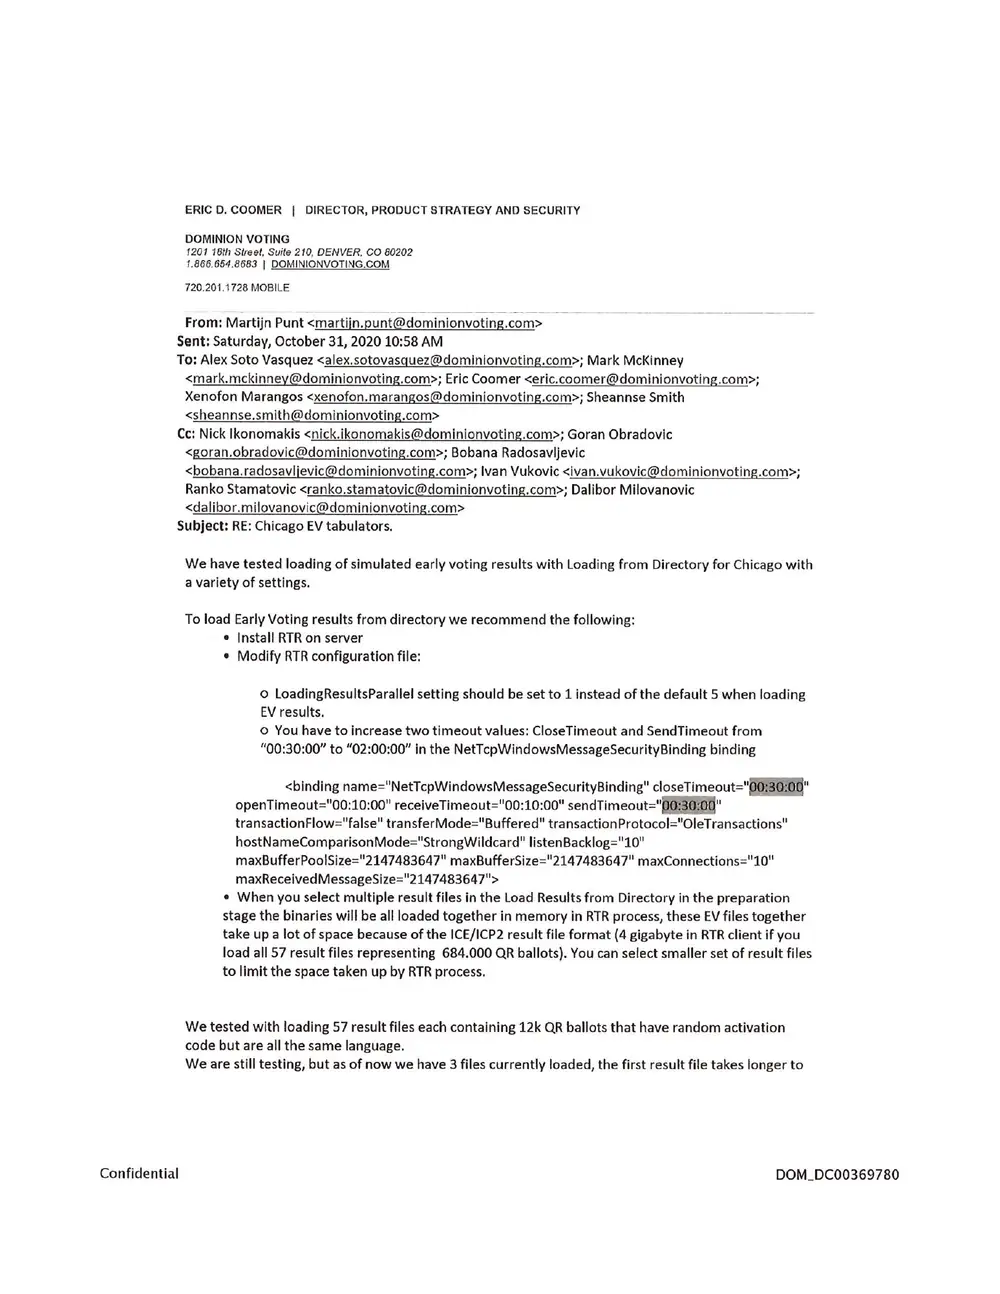
Exhibit 5, page 4 of 4: October 2020 Dominion Voting email from Martijn Punt recommending RTR configuration and timeout changes to load early-voting results from a directory, and reporting a test of 57 result files each holding 12,000 QR ballots.
Exhibit 5 · Page 4 of 4
06

Edmundo Rojas / Liberty Vote

Corrected work-history material referencing Dominion and Liberty Vote.

1 PAGE
Exhibit 6: LinkedIn profile page for Edmundo Rojas, Senior Product Specialist at Dominion Voting Systems, listing Liberty Vote and American River College and work history as Senior Product Specialist (contract) at Liberty Vote, with the key fields marked in red.
Exhibit 6
07

VPN and virtual machine

Corrected 2020 email imagery discussing a VPN connection and virtual machine.

1 PAGE
Exhibit 7: two stacked close-ups of a 30 March 2020 email titled “RE: VPN access with City” stating that a VPN connection was established from a new virtual machine so the team could reach the EMS servers, with the key lines outlined in magenta.
Exhibit 7
08

Serbia / Shanghai correspondence

Corrected correspondence concerning a tablet and Shanghai customs.

1 PAGE
Exhibit 8: two stacked email excerpts — a Dominion Voting signature block for Djordje Matijevic, Manager, Software Development, in Belgrade, Serbia, and a message noting that a tablet has arrived at Shanghai customs and is expected the following week.
Exhibit 8
← Back to the narrative

THE FOUR-PART FRAMEWORK

Follow the evidence trail.

Each step focuses on a different layer of the election process. Use the cards to move through the framework at your own pace.

02 PART TWO

Early-Voting Data

Consider the patterns and records associated with voting before Election Day.

View section
03 PART THREE

Election Model

Explore the model used to describe how votes move through an election system.

View section
04 PART FOUR

Reporting System

Examine the reporting layer and the public-facing records that shape election visibility.

View section

STEP 01 — VOTER ROLLS

Start with the record.

The voter database and its management form the first layer of this framework. The focus is on how active and inactive registrations change, how records are maintained, and what those changes show over time.

01
Database and management

The database question begins with voter-roll bloat: the accumulation of records for people who are deceased, have moved, are ineligible, or have not been removed under applicable procedures. The framework also considers registrations added through organized registration activity before elections, during the pre-election no-purge period.

Database management is examined alongside the record totals. The presentation describes the conversion of inactive, unpurged, or ineligible records to active status; the use of cryptographic shuffling or other methods that can obscure records; and the effect that registration totals can have on reported participation rates. It contrasts the reported participation rate with an approximately 78% historical presidential-election participation norm and asks how that comparison changes when calculated against active registered-voter totals.

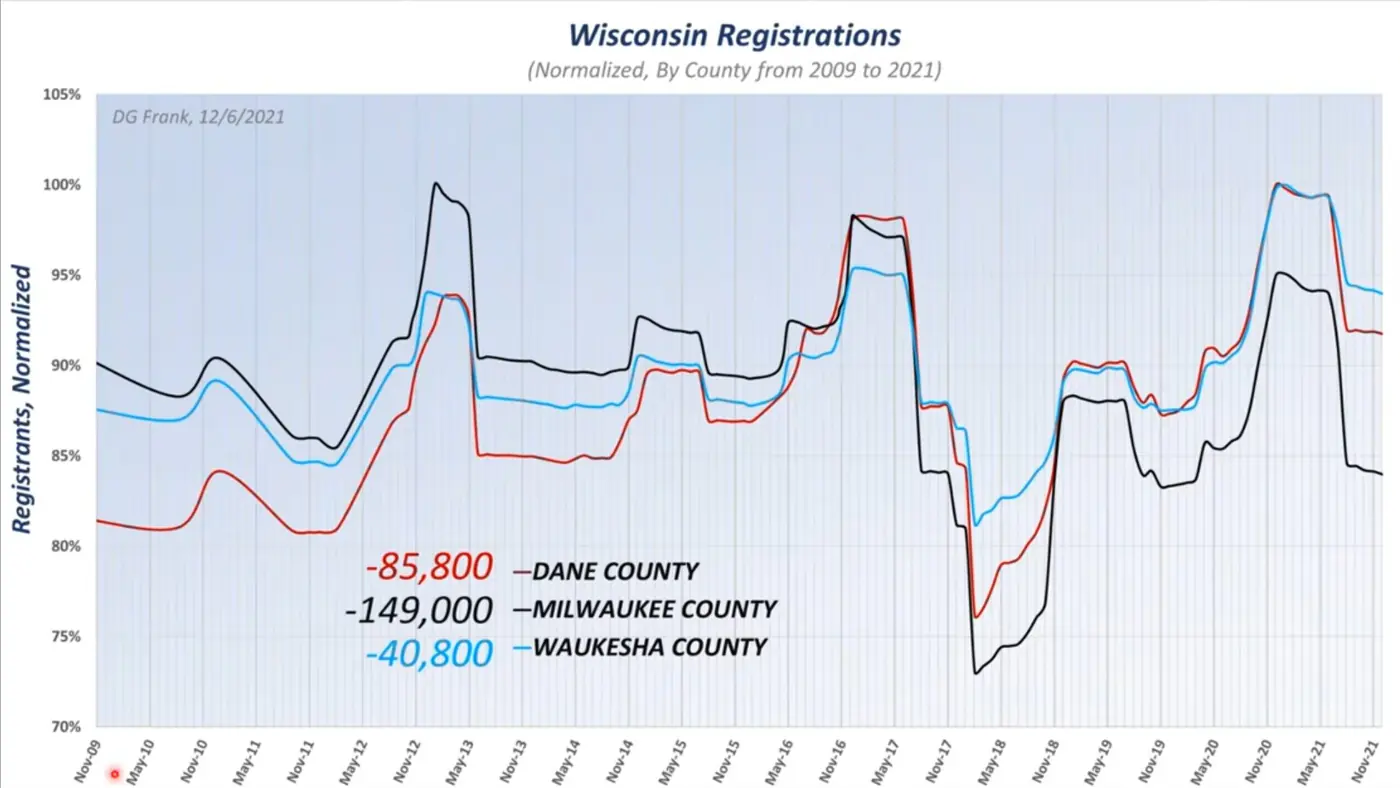
Line chart titled “Wisconsin Registrations (Normalized, By County from 2009 to 2021)” by DG Frank, comparing Dane County (-85,800), Milwaukee County (-149,000) and Waukesha County (-40,800), and showing registered voters rising sharply before and dropping sharply after each election.
FIG. 01 Wisconsin Voter Registrations Change

Comparing the data in a graph from three counties in Wisconsin from November 2009 through November 2021. Starting in November 2012, for every general election, the number of “active” voter registrations have changed as displayed in this graph. They increase dramatically before and then drop after the election in both the Fall General Election and more dramatically after the Spring General Election. The active voters increase by far more than the churn of about 3.5% as you can see. The swing in number of voters is not normal. The negative numbers for each county show the typical excess voter registrations removed after each election.

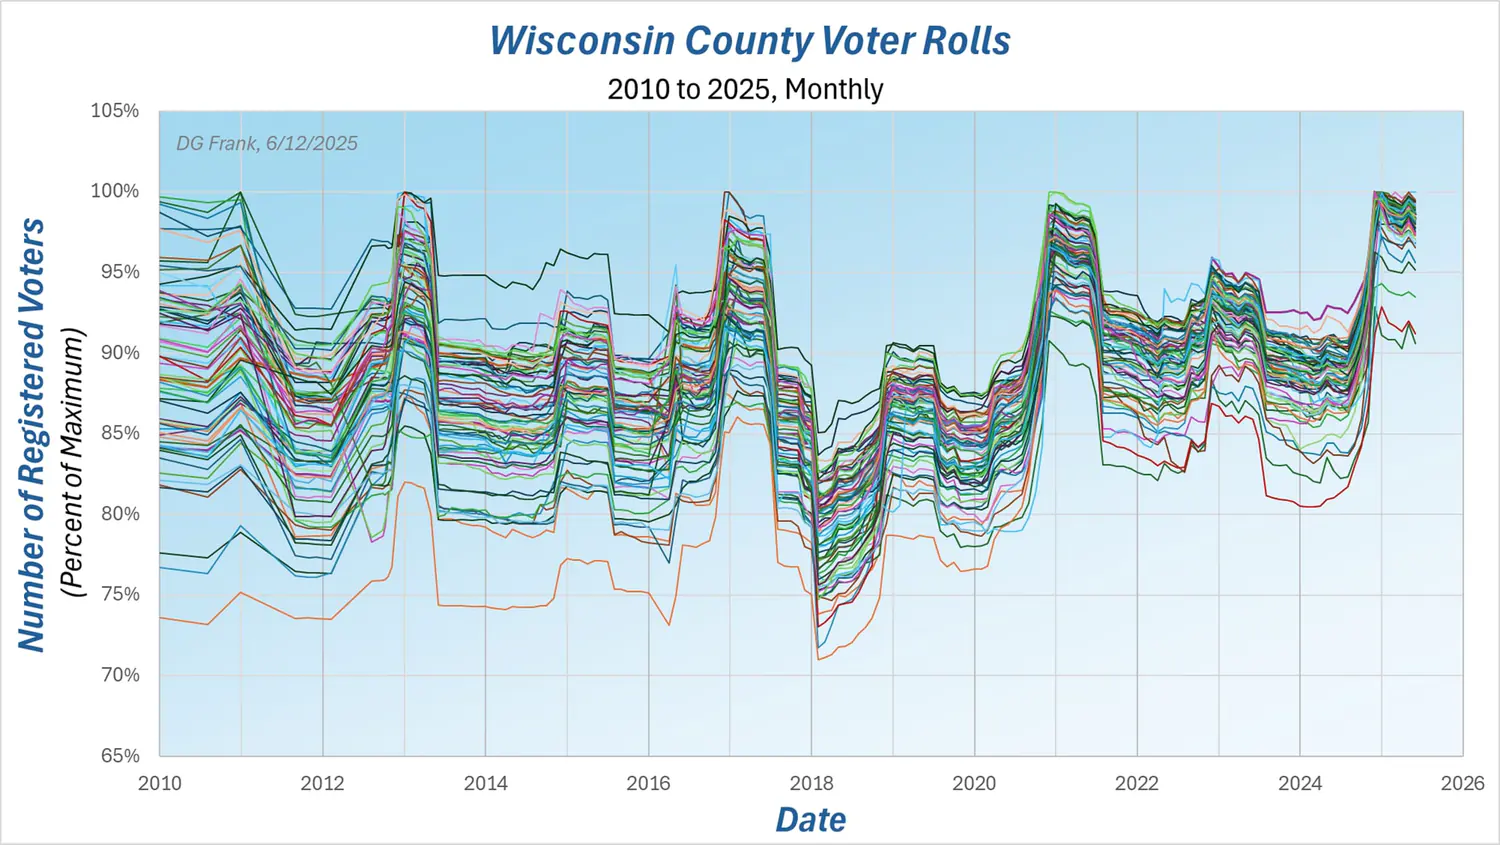
Line chart titled “Wisconsin County Voter Rolls, 2010 to 2025, Monthly” by DG Frank, plotting every Wisconsin county’s registered voters as a percent of that county’s maximum, with sharp peaks and drops around each general election.
FIG. 02 Wisconsin Voter Registrations in Every County

You can see the increasing and decreasing active registered voters November 2012 through May 2025 in all counties. There is a normal churn of movers and deceased people of about 3% every year, but this excessive swing goes far beyond the normal amount. Starting in November 2012, before every Fall general election, the number of “active” voter registrations for all 72 Wisconsin counties have changed in lockstep as displayed in this graph. They increase dramatically before and then drop after the elections—slightly after the Fall General Election and dramatically after the Spring General Election.

VOTER-ROLL RESOURCE

The Elector List

Use The Elector List to verify voter-registration data and vote-history records in Wisconsin and other participating states.

Visit The Elector List →

For public voter-data requests and official record access, see the Wisconsin Elections Commission’s Badger Voters information.

VIDEO / STEP 01 — VOTER-ROLL CHURN

Dane County Voter Roll Churn and Supporting Data — Douglas Frank, PhD.

VIDEO / STEP 01 — REGISTERED VOTERS VS. ELIGIBLE POPULATION

Voting Eligible Population vs. Voter Rolls — Douglas Frank, PhD.

VIDEO / STEP 01 — WISCONSIN VOTER REGISTRATIONS

WI Evidence of Fraud — Voter Registrations — Douglas Frank, PhD.

STEP 02 — EARLY-VOTING DATA

Model Election Day before Election Day.

Early-voting data is presented as the current-election input to an outcome model. First, historical voter-participation and preference data establish a reference model. Next, current early-voting activity is compared with the same stage of prior comparable elections. The resulting comparison is used to model a projected Election Day result in advance of Election Day.

In this framework, early voting is not a separate endpoint: it is the live data layer that tests and updates the historical model. Timing, volume, geography, and voting-method records can be organized into an ongoing comparison as the election progresses.

Wisconsin’s Elections Commission provides the Badger Voters system for voter and absentee-data requests. The researcher-document library will connect this official data-access route with the analyses and exhibits added to the site.

RESOURCE LINKS — Electiondataguy.com · Wisconsin Elections Commission / Badger Voters

VIDEO / STEP 02
Early-voting data and historical comparison

Add the approved Odysee video or external resource here.

STEP 03 — ELECTION MODEL

Make the model understandable.

Election modeling is used to predict election results. Many models begin with opinion polling, which can change quickly. This framework instead describes a more precise model built from historic voting data held in state voter databases and refined with voter-preference research.

Applied to an established model, early-voting data can be used to project an election result before Election Day. The presentation describes a model that can be used to estimate the number of ballots needed to prevail before Election Day, then asks viewers to consider how a model, historical records, and current election data operate together.

01 / HISTORICAL DATA 02 / EARLY VOTE 03 / PROJECTION
VIDEO / STEP 03
Electiondataguy — predictive election modeling

Add the approved presentation or external resource here.

STEP 04 — VOTING & REPORTING SYSTEMS

Follow the system through to the report.

The electronic voting-system portion addresses vulnerabilities identified by technical specialists over more than fifteen years: backdoors and vote-manipulation methods, coding practices, communications-port protections, hidden software features, equipment-source questions, and the use of modems to transmit totals.

The Patrick Byrne presentation examines a hidden server alleged to be used to manipulate election data. The accompanying court-evidence emails are listed as material connecting a Dominion executive to that server. The presentation is intended for a non-technical audience and explains that a hidden server need not be a separate physical device; it could be a virtual machine or a software-implemented resource operating inside existing election-management infrastructure.

Such a resource could use part of an existing server’s processor time and self-terminate when the system is powered off. The presentation also discusses litigation and a gag order related to the system information. A separate technical presentation by Mark Cook walks through vulnerabilities identified in voting-system software.

MATERIALS — Patrick Byrne video · Dominion emails · Mark Cook technical presentation

SEPARATE CONTEXT

International context.

This material is kept apart from the four-part framework as a broader background section.

05

Broader systems, local questions.

The complete Dr. Frank presentation includes material about a trip to address election issues in Korea. Additional declassified documents released through the White House website, together with a presidential address to the nation, are listed as background material for the issues discussed on this page.

Related materials include: the relevant portion of the Dr. Frank presentation; the complete Dr. Frank presentation; Electiondataguy.com for predictive election modeling; the Patrick Byrne hidden-server video; Patrick Byrne’s Dominion emails; and the Mark Cook technical presentation.

Continue to the proposed solution →
VIDEO / INTERNATIONAL CONTEXT

South Korea Elections Compared to U.S. Elections — Dane County, July 2026 by Douglas Frank, PhD.

THE PROPOSED SOLUTION

Local audit. Local visibility.
Local control.

The proposed response is to organize locally, examine records, document questions, and work with municipal election officials.

01 Review voter rolls locally
02 Compare snapshots over time
03 Check records associated with known addresses
04 Document questions or anomalies
05 Organize multiple residents
06 Work with municipal election officials
WATCH THE PROPOSED SOLUTION

How to Take Elections Back — Dane County, July 2026 by Douglas Frank, PhD.

The work begins with records residents can see, compare, document, and discuss in their own communities.

START WITH YOUR OWN NEIGHBORHOOD

Ready to participate?

Join with neighbors to review local records, document questions, and take part in direct local oversight.

EVENT DETAILS · EMAIL SIGNUP · LOCAL ORGANIZING LINK